The video of the Dec 2023 Montreal.rb Ruby Meetup A.I. talk "Building
LLM-powered Applications" by Andrei Bondarev (Solutions Architect / Owner
at Source Labs LLC) has been posted. The 2023 breakthroughs in Generative
AI (Artificial Intelligence) have been taking the software development
world by storm. We'll take a look at a few components of what is quickly
becoming the modern stack for building LLM (Large Language Model) powered
applications. Andrei will build a case for Ruby in the emerging AI trend,
and show how some of the AI capabilities can be leveraged today!
https://www.youtube.com/watch?v=KQlgWT6y5QY&list=PLRAf4zt5oEjc2mqmEN9m_O0Jo…
The video and slides for the Nov 2023 Montreal.rb Ruby Meetup talk "Anatomy
of a Payment" by Michel Jamati (CTO/Co-Founder of Lexop) have been posted!!
This talk will provide an overview of the business payment world. Attendees
will become familiar with the actors and economics of the payment
ecosystem, learn about the major regulations in the payment space that need
to be complied with, and understand the Lexop approach to navigating these
different challenges. Ruby on Rails examples will be demonstrated along the
way to illustrate various types of payments that can be made with different
payment processors.
YouTube Video :
https://www.youtube.com/watch?v=tbkVH0q3Vik&list=PLRAf4zt5oEjc2mqmEN9m_O0Jo…
PowerPoint Slides :
https://docs.google.com/presentation/d/e/2PACX-1vRbkntSxjQa_vZvVl5lvnkLbHvk…
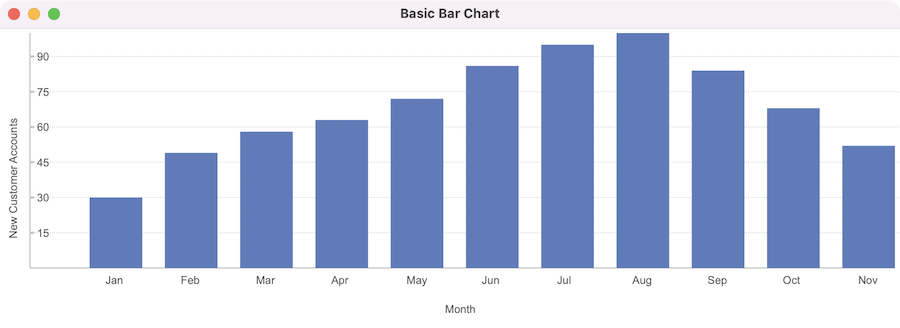
Graphs and Charts 0.2.2 adds a new Bar Chart Custom Control for Glimmer DSL
for LibUI (Prerequisite-Free Ruby Desktop Development Cross-Platform Native
GUI Library).
https://raw.githubusercontent.com/AndyObtiva/glimmer-libui-cc-graphs_and_ch…
GitHub : https://github.com/AndyObtiva/glimmer-libui-cc-graphs_and_charts
RubyGem : https://rubygems.org/gems/glimmer-libui-cc-graphs_and_charts
Blog Post Announcement :
https://andymaleh.blogspot.com/2024/01/graphs-and-charts-02x-bar-chart-for.…
Change Log:
0.2.2 :
- Display bar_chart axis labels x_axis_label and y_axis_label
- Display bar_chart x-axis values below the chart
- Fix issue with bar_chart vertical scaling of grid markers when numbers
are larger than 1000 and have K in them by disabling K formatting for now
(the issue was seeing the same marker number twice because two consecutive
markers were calculated with similar shortened values; e.g. both 10K when
one is 10100 and the other is 10750).
0.2.1 :
- Fix clipped text of grid markers when they include 1000 displayed as 1K
0.2.0 :
- Initial implementation of bar_chart custom control
- New examples/graphs_and_charts/basic_bar_chart.rb
